Daily decisions involve more data, more calculations and more manual work than ever before.
What if complex energy decisions became understandable in seconds?

Making complex energy decisions simple,
clear and actionable.
Daily decisions involve more data, more calculations and more manual work than ever before.
What if complex energy decisions became understandable in seconds?
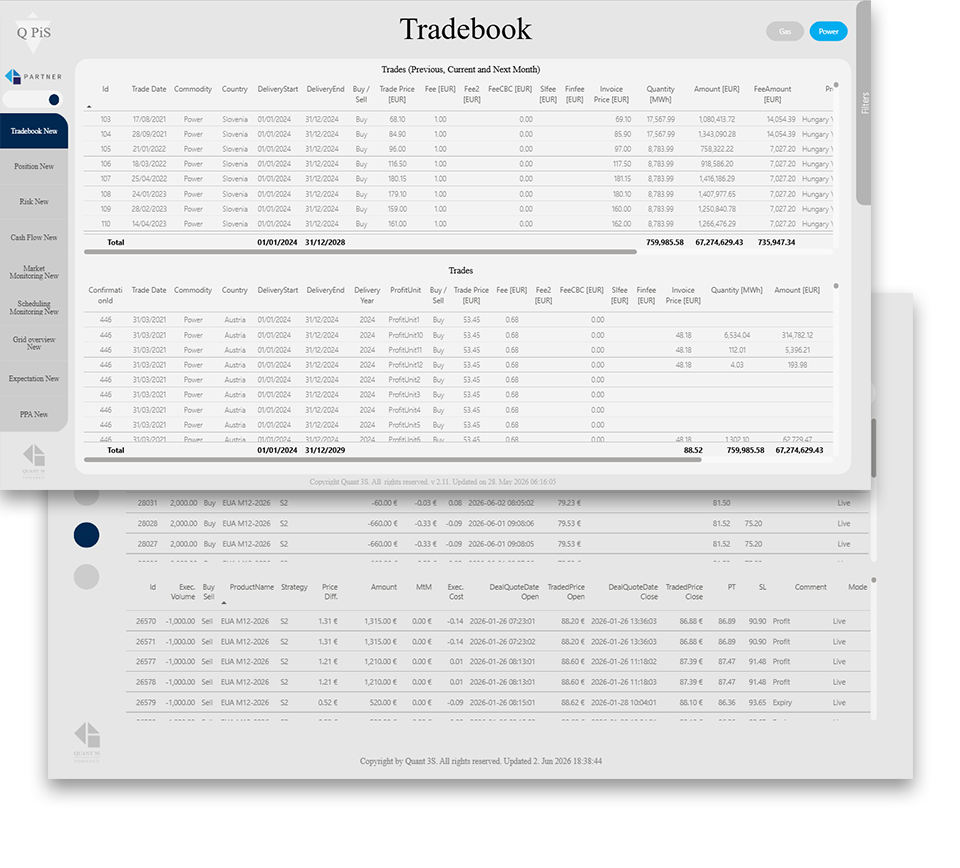
Tradebook contains a list of all concluded commodity transactions with contract information and a list of trade plans based on pre-planned strategies.
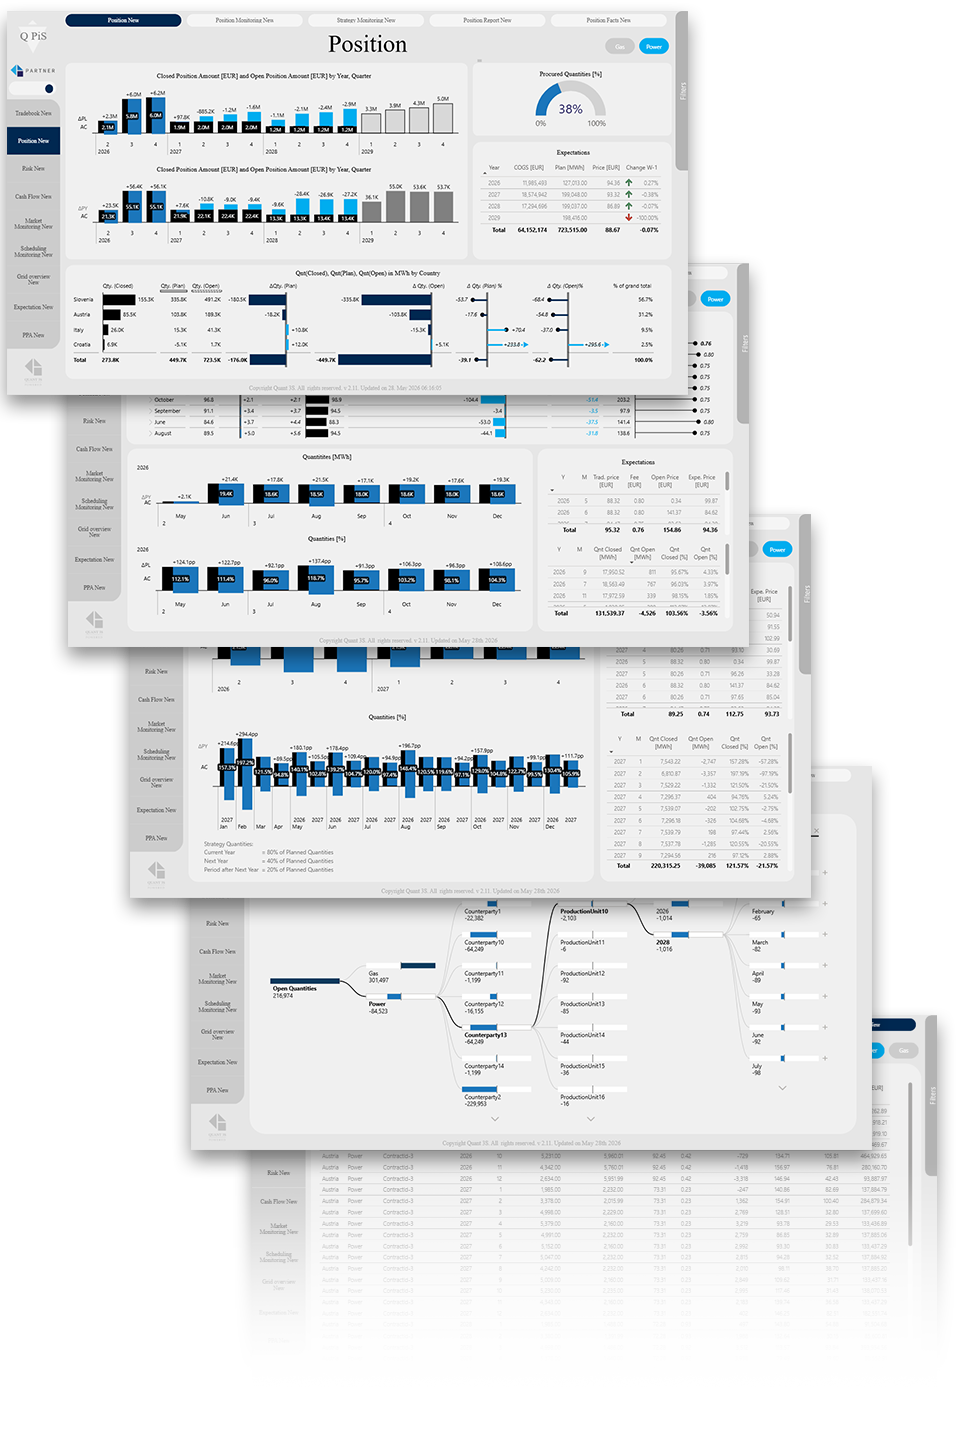
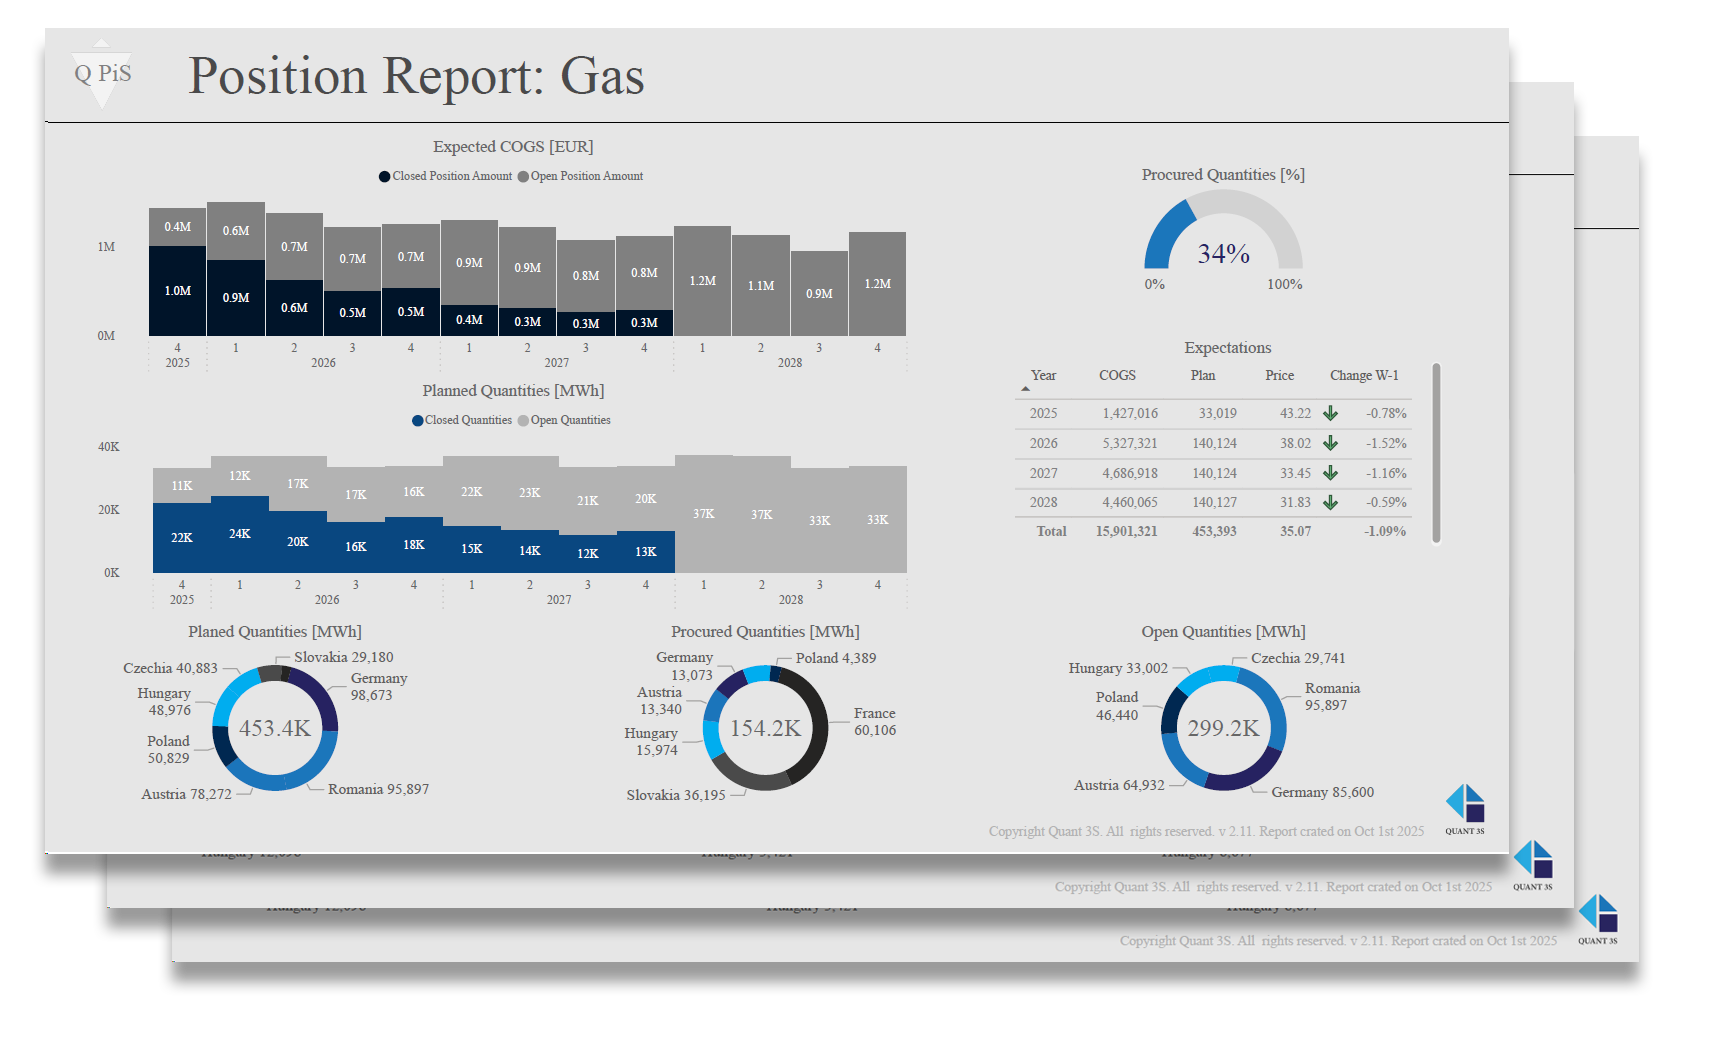
Position module includes both procured and future deals based on mark-to-market assessment, providing a clear value of weighted purchase price at any given time including margins.
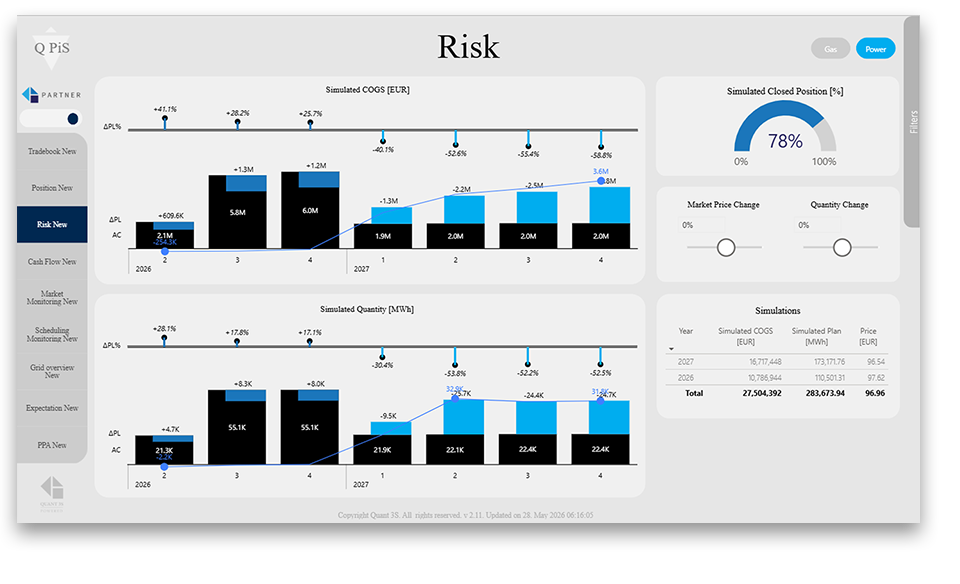
Risk consists of “What-If” scenarios, stress tests, and VaR (Value-at-Risk) estimates. The implementation of “What-If” scenarios ensures a dynamic calculation of expected commodity prices. The aim is to identify possible undesirable price levels in a market that need to be addressed before they occur.
Risk module also includes VaR calculations, calculated using the variance-covariance method, to measure and control the level of risk exposure.
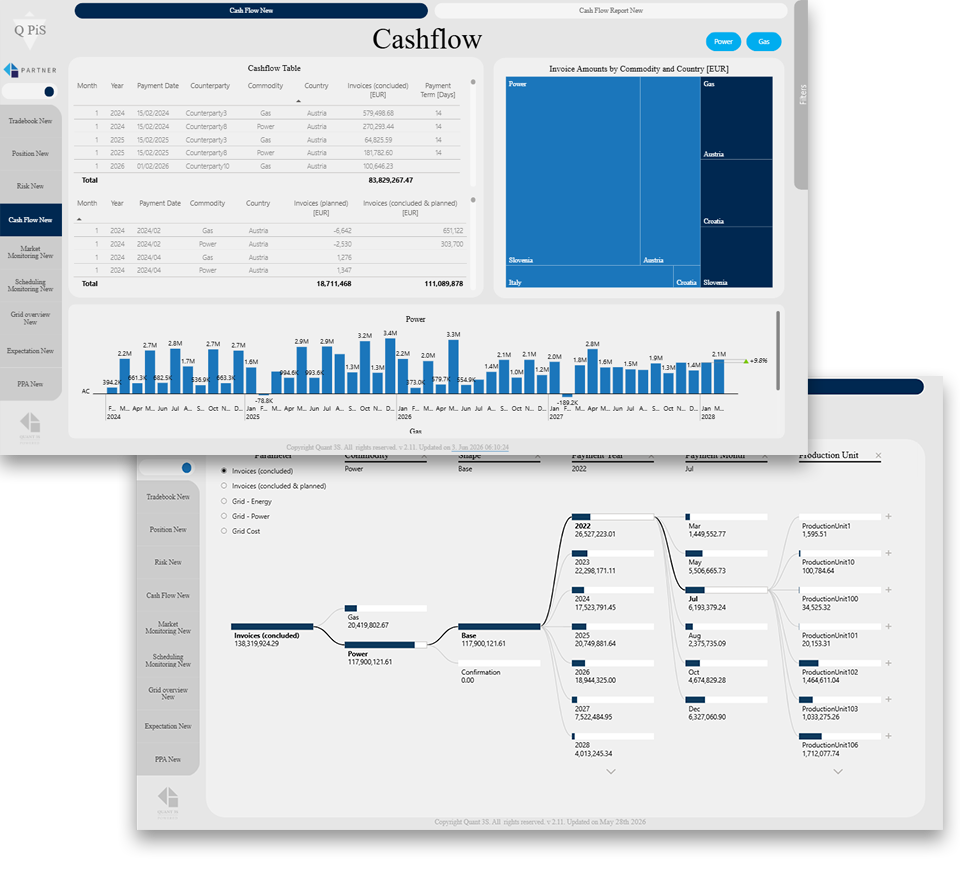
Cash flow calculation provides an overview of expected cash obligations based on concluded transactions for all commodities, as well as planned transactions.
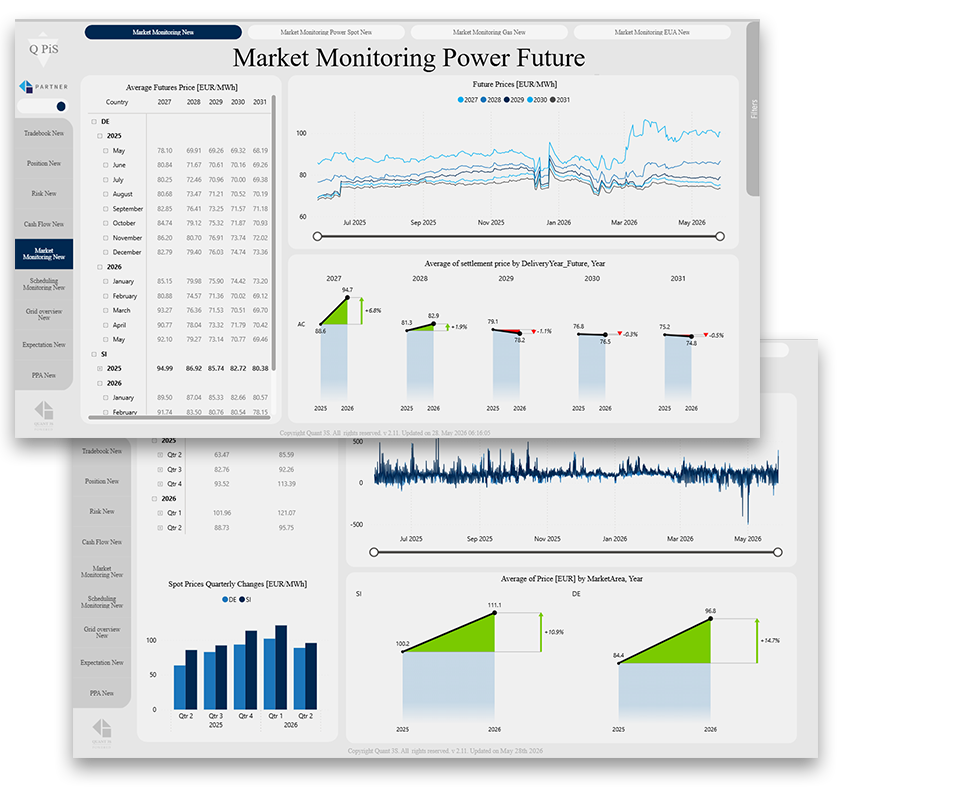
Spot and futures market price analytical module provides access to historical spot and futures prices for selected commodity markets.
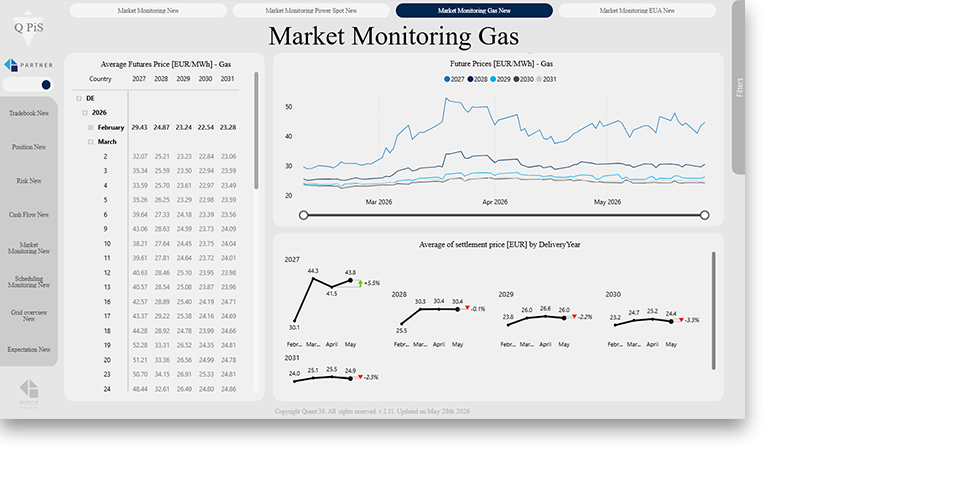
Market monitoring provides a structured overview of gas market developments, price movements and key market indicators to support procurement decisions.
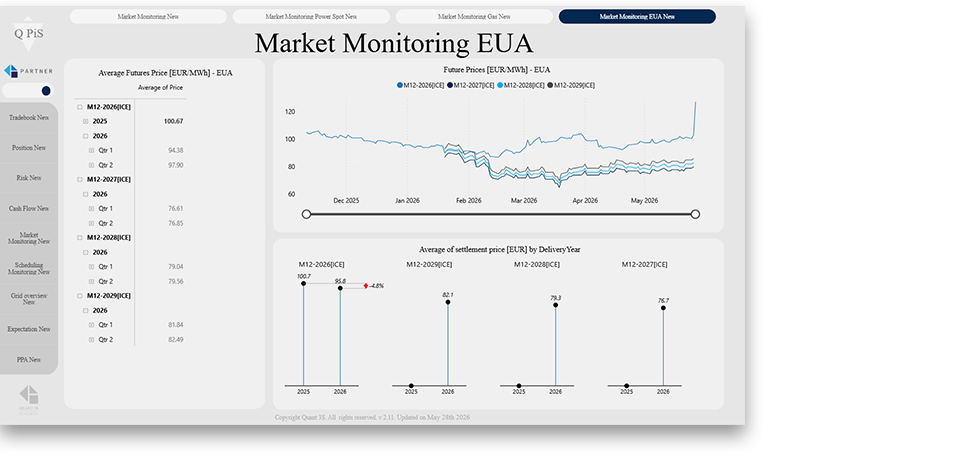
Market monitoring also provides insight into EUA.
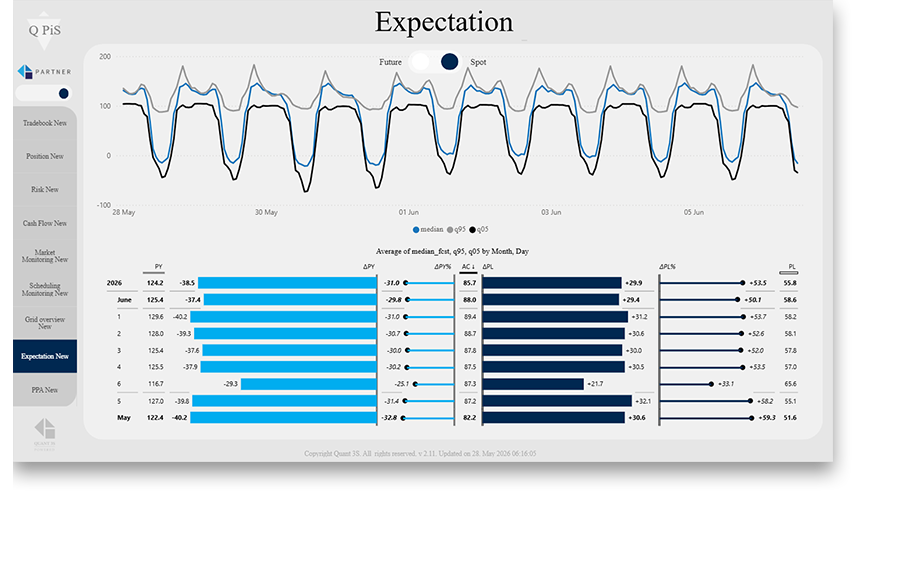
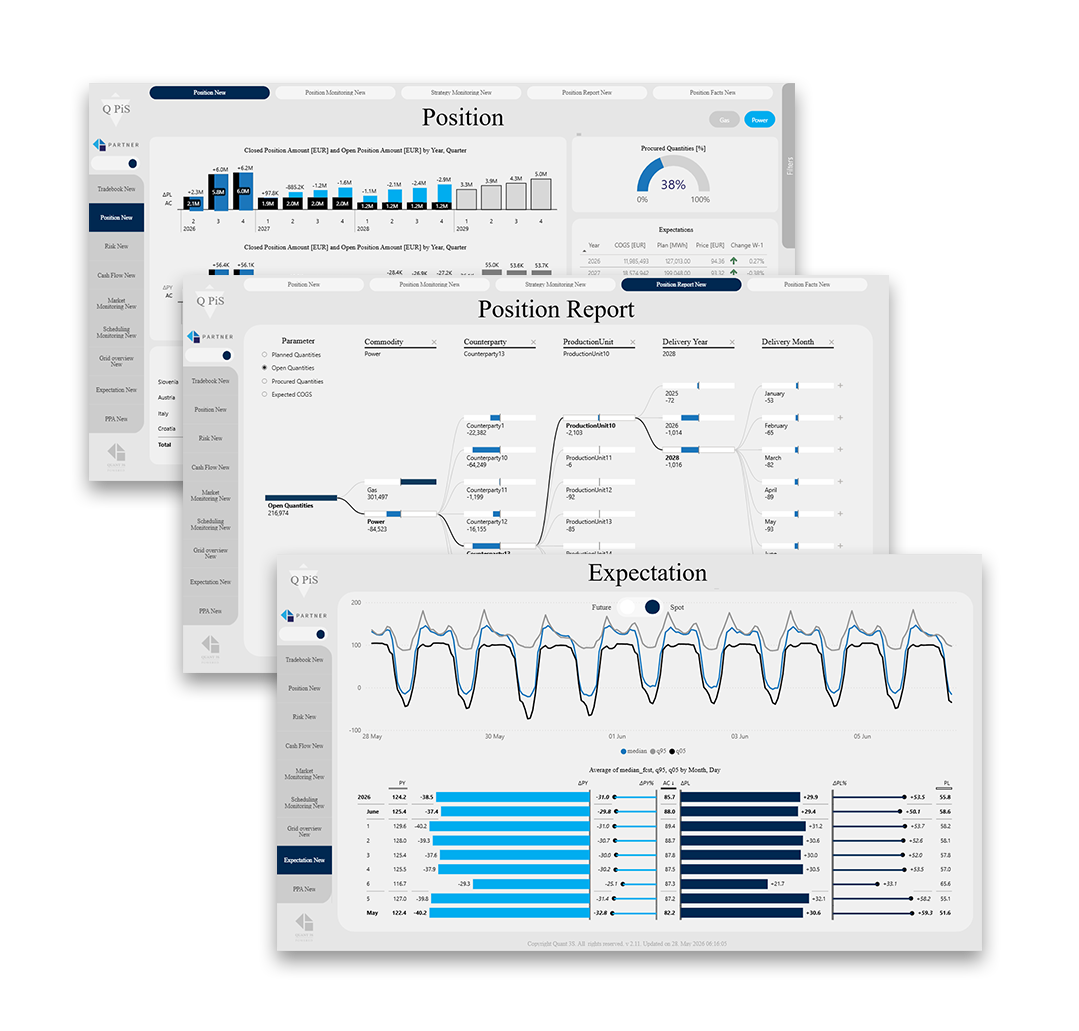
Spot expectations are generated using a state of-the-art machine learning model designed to forecast day-ahead spot market prices. In addition to hourly price forecasts for the next 10 days, we provide a confidence interval, representing the range within which we expect spot prices to fall.
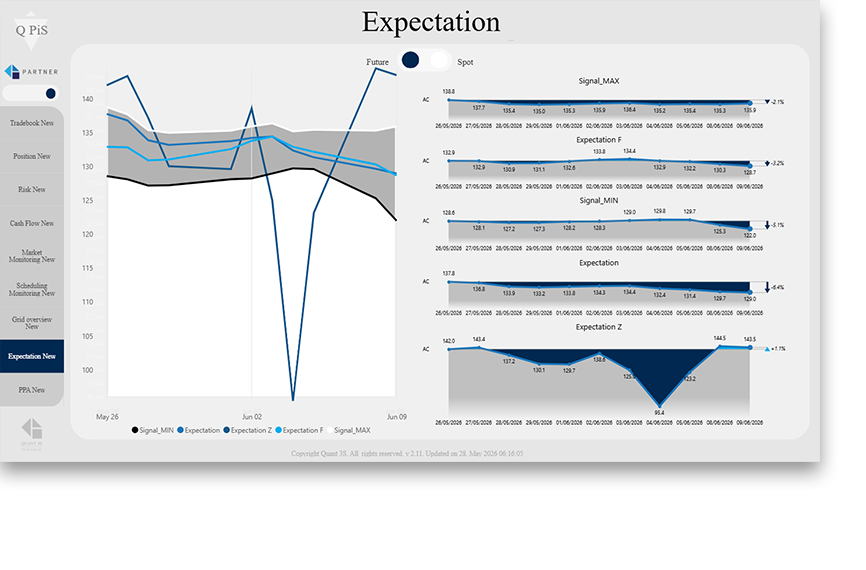
Future expectations delivers yearly, quarterly and monthly portfolio evaluation, based on current positions, market data and forecast consumptions. The module helps to quantify potential future financial impacts, assess exposure under different scenarios and support long-term procurement planning.
Q PiS combines portfolio, market, operational and financial data into a single source of truth, enabling faster decisions and greater transparency across the organization.
THE DAILY REALITY FOR ENERGY TEAMS

Information
Overload

Manual
Process

Outdated
Reports

Visibility
Gaps

High
expectations
WHAT ENERGY TEAMS AIM TO ACHIEVE

Simplify
Processes

Digitize
End-to-End

Reduce
Manual Work

Empower Experts
to Create Value

Better visibility,
better decisions,
better results

Q PiS
Q PiS generates standard or tailored PDF reports based on customer specific business logic. Reports are delivered automatically via email at preset intervals.
Automated reports can be configured using flexible filtering criteria and hierarchical reporting structures, enabling organizations to align portfolio reporting with their internal reporting requirements and management structure.
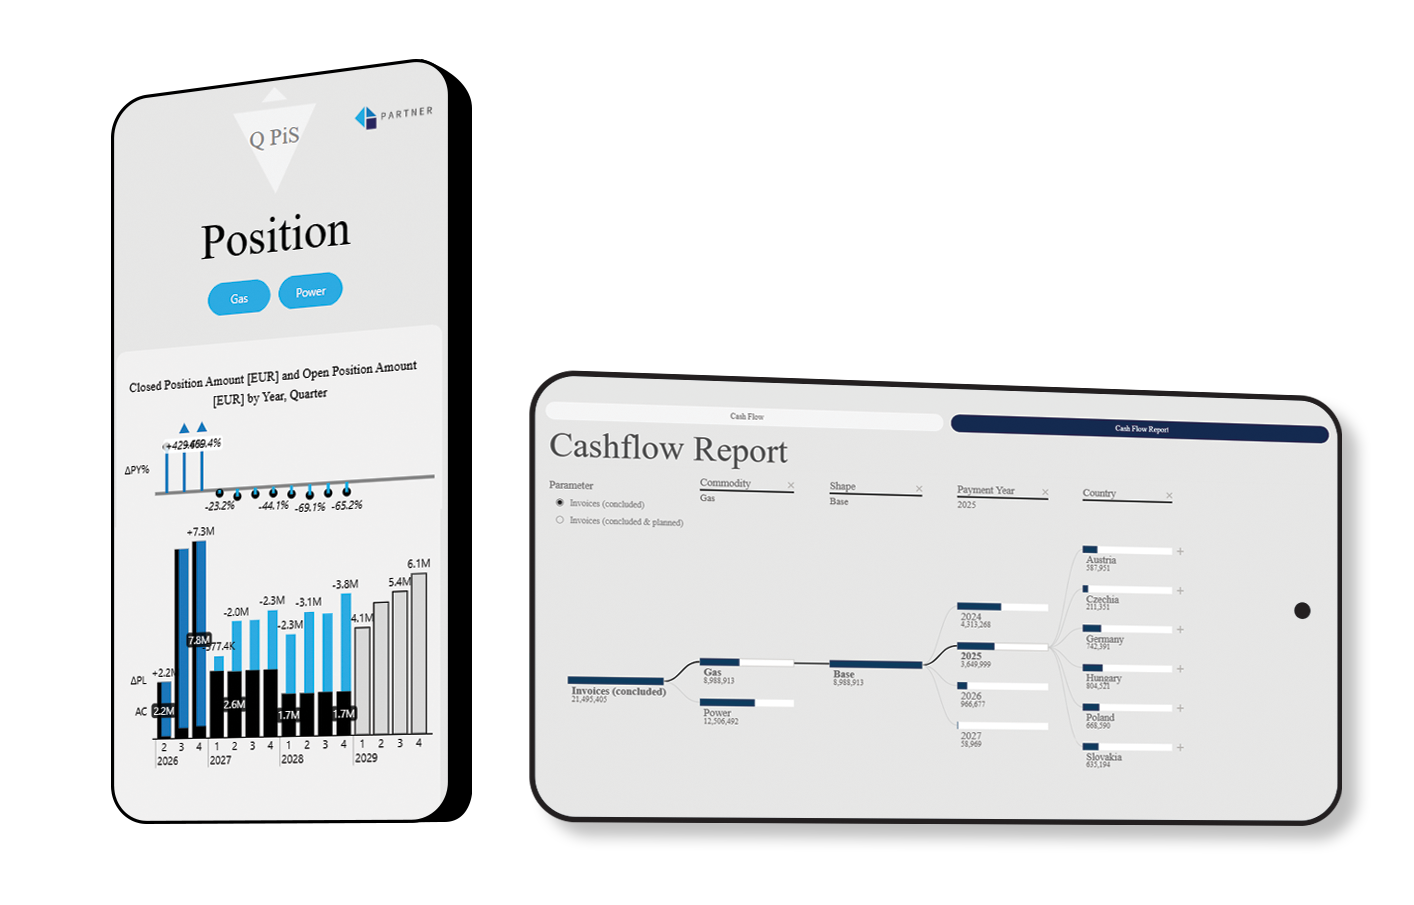
Q PiS is always with you, in the office or on the go. It is your first choice before you make the right decision.
One platform. Tailored to your business needs.
Q PiS platform is a modular software that adapts to the size, complexity and maturity of your energy
procurement needs. Start with the essentials and expand functionality as your business grows.

Essential visibility for smaller energy consumers

Structured monitoring and decision support

Advanced analytics and risk management for complex portfolios

One modular platform, scalable to your needs.
All modules are built on the same robust architecture and data model. Seamlessly scale from Light to Business to Premium as your needs evolve.


See what can we do for you
Find us at the office
QUANT 3S, Research and Development, d.o.o.
Miklošičeva cesta 7A
1000 Ljubljana
Slovenia, EU